Why did my Availability Group Failover?
Introduction
In this lab, you will try to identify and fix the cause for an availability group failover.
Objectives
At the end of this lab, you will be able to:
- Understand the issue that is caused the availability group failover.
- Fix the issue and get the availability group back to a healthy state.
Estimated Time
45 minutes
Logon Information
Use the following credentials to login into virtual environment
- Username: corpnet\cluadmin
- Password: Pa$$w0rd
Before starting the training module, we recommend that you launch the labs and give them some time to stabilize. Please be aware that sometimes the AG may be in a resolving state and AG Replicas may be in a disconnected state. This is a platform issue and should stabilize after a few minutes
Environment review
Before you begin with the first exercise in the lab, let's review the lab environment.
In the lab, you have one Domain Controller and 3 nodes + 1 client computer.
AlwaysOnN1 and AlwaysOnN2 nodes are in the primary Datacenter.
AlwaysOnN3 is in the secondary datacenter.
For this lab, both the datacenters are in the same subnet.
Each node has Windows Server 2022 O/S installed.
SQL Server 2022 Standalone instances are installed on all the 3 nodes (i.e. AlwaysOnN1, AlwaysOnN2, AlwaysOnN3).

Exercise 1: Identify why AOCorp failed over and fix the issue
In this exercise, you will learn why AOCorp failed over and fix the issue.
Tasks
Logon to AlwaysOnClient, open SQL Server Management Studio (SSMS) and connect to AOCorpList.
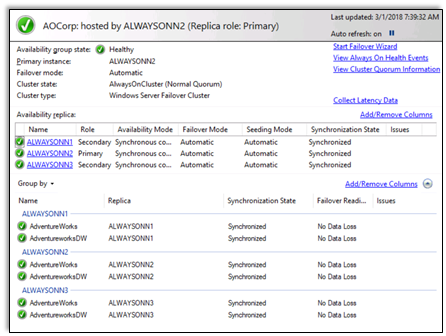
Expand the Availability Group node, right-click AOCorp and select Show Dashboard. AOCorp should be healthy, with AlwaysOnN2 as the primary replica:

Minimize SSMS, go to the desktop, and locate a shortcut named Inject Failover Issue. Right-click the shortcut, select Run as Administrator and wait for it to finish.

Back to SSMS, check the dashboard for the availability group AOCorp. AlwaysOnN1 should be the primary replica, AlwaysOnN2 is not synchronizing:

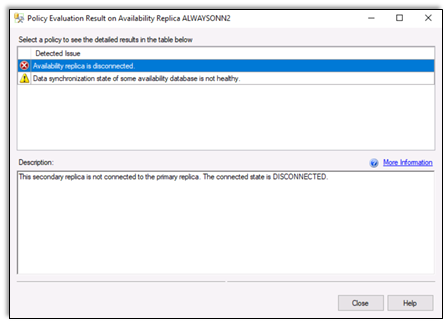
In the AOCorp dashboard, click the link with the critical error for availability replica AlwaysOnN2. This replica is disconnected, and the synchronization state is not healthy.


In SSMS, try to connect to the AlwaysOnN2 replica, it should error out with The network path was not found.

Find the root cause using the guidelines and cheat sheet provided below.
Guidelines
This is a non-guided activity and the attendees are expected to try and troubleshoot this issue on their own.
You can use any resources (including the internet or your own scripts), to troubleshoot the issue.
You can use the tools discussed in the first module to help troubleshoot the issue.
The possible causes discussed earlier in the lesson can be used as guidance for troubleshooting.
The instructor will discuss the troubleshooting steps, cause and solution in detail after this lab session.
You might have to login directly on the individual nodes to troubleshoot the issue.
Ask yourself the below questions:
- Where do you start?
- What logs will provide me additional insights?
- What tools can I use to troubleshoot this issue?
- Could one or more of the possible causes discussed earlier be the issue here?
Cheat Sheet
Here are some tools that you use to troubleshoot the issue.
- Failover Cluster Manager
- SQL Server Management Studio
- Windows Event Viewer
This is not a complete list of commands/tools to help troubleshoot this issue. There are various ways/methods/approaches to troubleshoot an issue. These commands/tools referenced here could be used to look up/identify useful information for this lab.
Below are some logs that you may want to analyze.
- Windows Application and System Log
- Windows Cluster Log
- SQL Server Error Logs
- SQL Server Cluster Diagnostics log (stored in the same folder as the SQL Server Errorlogs) – (Node Name)_(Instance Name)_DIAG*.xel
To generate and collect the cluster logs of all nodes in the cluster:
Run PowerShell as administrator and run the below commands
PowerShellImport-Module FailoverClusters
Get-ClusterLog
Default command Get-ClusterLog generates cluster.log file on ALL nodes in C:\Windows\Cluster\Reports folder.
All messages are logged using UTC/GMT time. Sometimes it's difficult to translate UTC time to local time, especially for time-zones which has daylight saving. Luckily, cluster log can be generated in local time using parameter UseLocalTime. Here is the sample code.
PowerShellGet-ClusterLog –UseLocalTimeAnother useful parameter is to copy the files to specific location. This command would generate logs and also dump on specified location. in below example, I am dumping logs from all nodes to C:\Temp folder.
PowerShellGet-ClusterLog –Destination "C:\Temp"
Congratulations!
You have successfully completed this exercise. Click Next to advance to the next lab.